Changelog
Hardened Security & Stability
We dedicated this cycle to the invisible infrastructure that makes Nooryx trustworthy. Security upgrades often come at the cost of usability, resulting in slower workflows or cumbersome hurdles. Our goal was the opposite: to harden the platform while removing friction.
We have completely rebuilt how sessions are handled to eliminate the annoyance of frequent logouts. The system now performs continuous security verifications in the background, keeping you securely logged in. This balances strict access control with a seamless experience, ensuring you are never interrupted in the middle of a task to re-enter credentials.
Behind the scenes, we also bolstered the platform’s defenses against external threats. We introduced intelligent safeguards to detect and block abusive traffic patterns, protecting your workspace from brute-force attempts without slowing down legitimate users. Additionally, we added stricter validation to every data modification, verifying the origin of every command to ensure your inventory records can never be tampered with by unauthorized sources.
Performance & Fluidity
Speed is a defining feature of the Nooryx experience. We fine-tuned the interface to make the application feel instant and fluid, even when working with large inventory datasets. Our goal is simple: Nooryx should move as fast as you do, with a smooth framerate and no stutter or lag.
We also optimized how the system handles complex visualizations. Interactions with the dashboard (like resizing the window or toggling sidebars) now feel immediate. By removing unnecessary background calculations, charts and data tables update instantly instead of lagging behind your actions.
Beyond performance, we improved how Nooryx fits into your workflow. The app now remembers your view preferences, including selected time periods and chart granularity, so you don’t need to reconfigure your dashboard every time you log in. We also polished the mobile web experience, adjusting the layout of key metrics so critical data stays clear and readable on smaller screens.
Feedback Loops & Integrations
We have completed the core infrastructure for our first native connector. The secure authentication and real-time data pipelines needed to ingest orders and sync inventory are fully operational in our testing environment.
However, we are holding back the public release until Nooryx receives formal verification from Shopify. We are currently moving through their official review process. This ensures that when the integration goes live, it meets strict security and reliability standards. We will open access immediately upon certification.
Additionally, we added a direct line to product engineering via the sidebar. Feedback should not require leaving your workspace or context switching. If you encounter a bug or have an idea for improvement, you can now share it instantly. These messages go directly to the Nooryx team.
Barcode Scanning
We’ve released native Barcode Scanning to bridge the gap between physical stock and digital records. The system now supports both professional USB/Bluetooth hardware scanners and standard device cameras.
Scanners now drive the entire workflows (Receive, Ship, Lookup, etc.). This capability removes the need for manual keyboard input during high-volume operations and guarantees that the item in your hand matches the record on the screen.
When you scan a code, Nooryx resolves it instantly to the associated SKU. If the system encounters an unrecognized barcode, the linking process is straightforward. You simply search for the correct product, click "Link Barcode," and the association is permanently saved for all future scans.
The Documentation

We’ve launched our comprehensive documentation site to serve as the guide to the Nooryx platform. Nooryx prioritizes strict data integrity over the approximate logic found in many lightweight tools. This approach relies on specific concepts (like immutable Ledgers and Hard Reservations) that differ from standard spreadsheets or legacy ERPs. The documentation bridges this gap and establishes a clear mental model of how the system behaves.
We designed the documentation as an active learning tool rather than a collection of static text. Key foundational concepts feature interactive simulations where you can adjust variables directly to see exactly how the system reacts.
A prime example is our guide on Valuation. Concepts like Weighted Average Cost (WAC) or FIFO can be difficult to visualize when purchase prices fluctuate. Our interactive guides simulate receiving and shipping stock at different price points, clearly illustrating how Nooryx calculates value in real time.
This resource covers the full spectrum of the platform, from initial workspace setup to complex inventory logic. It gives your team the deep operational knowledge required to manage inventory with confidence.
Stock Alerts
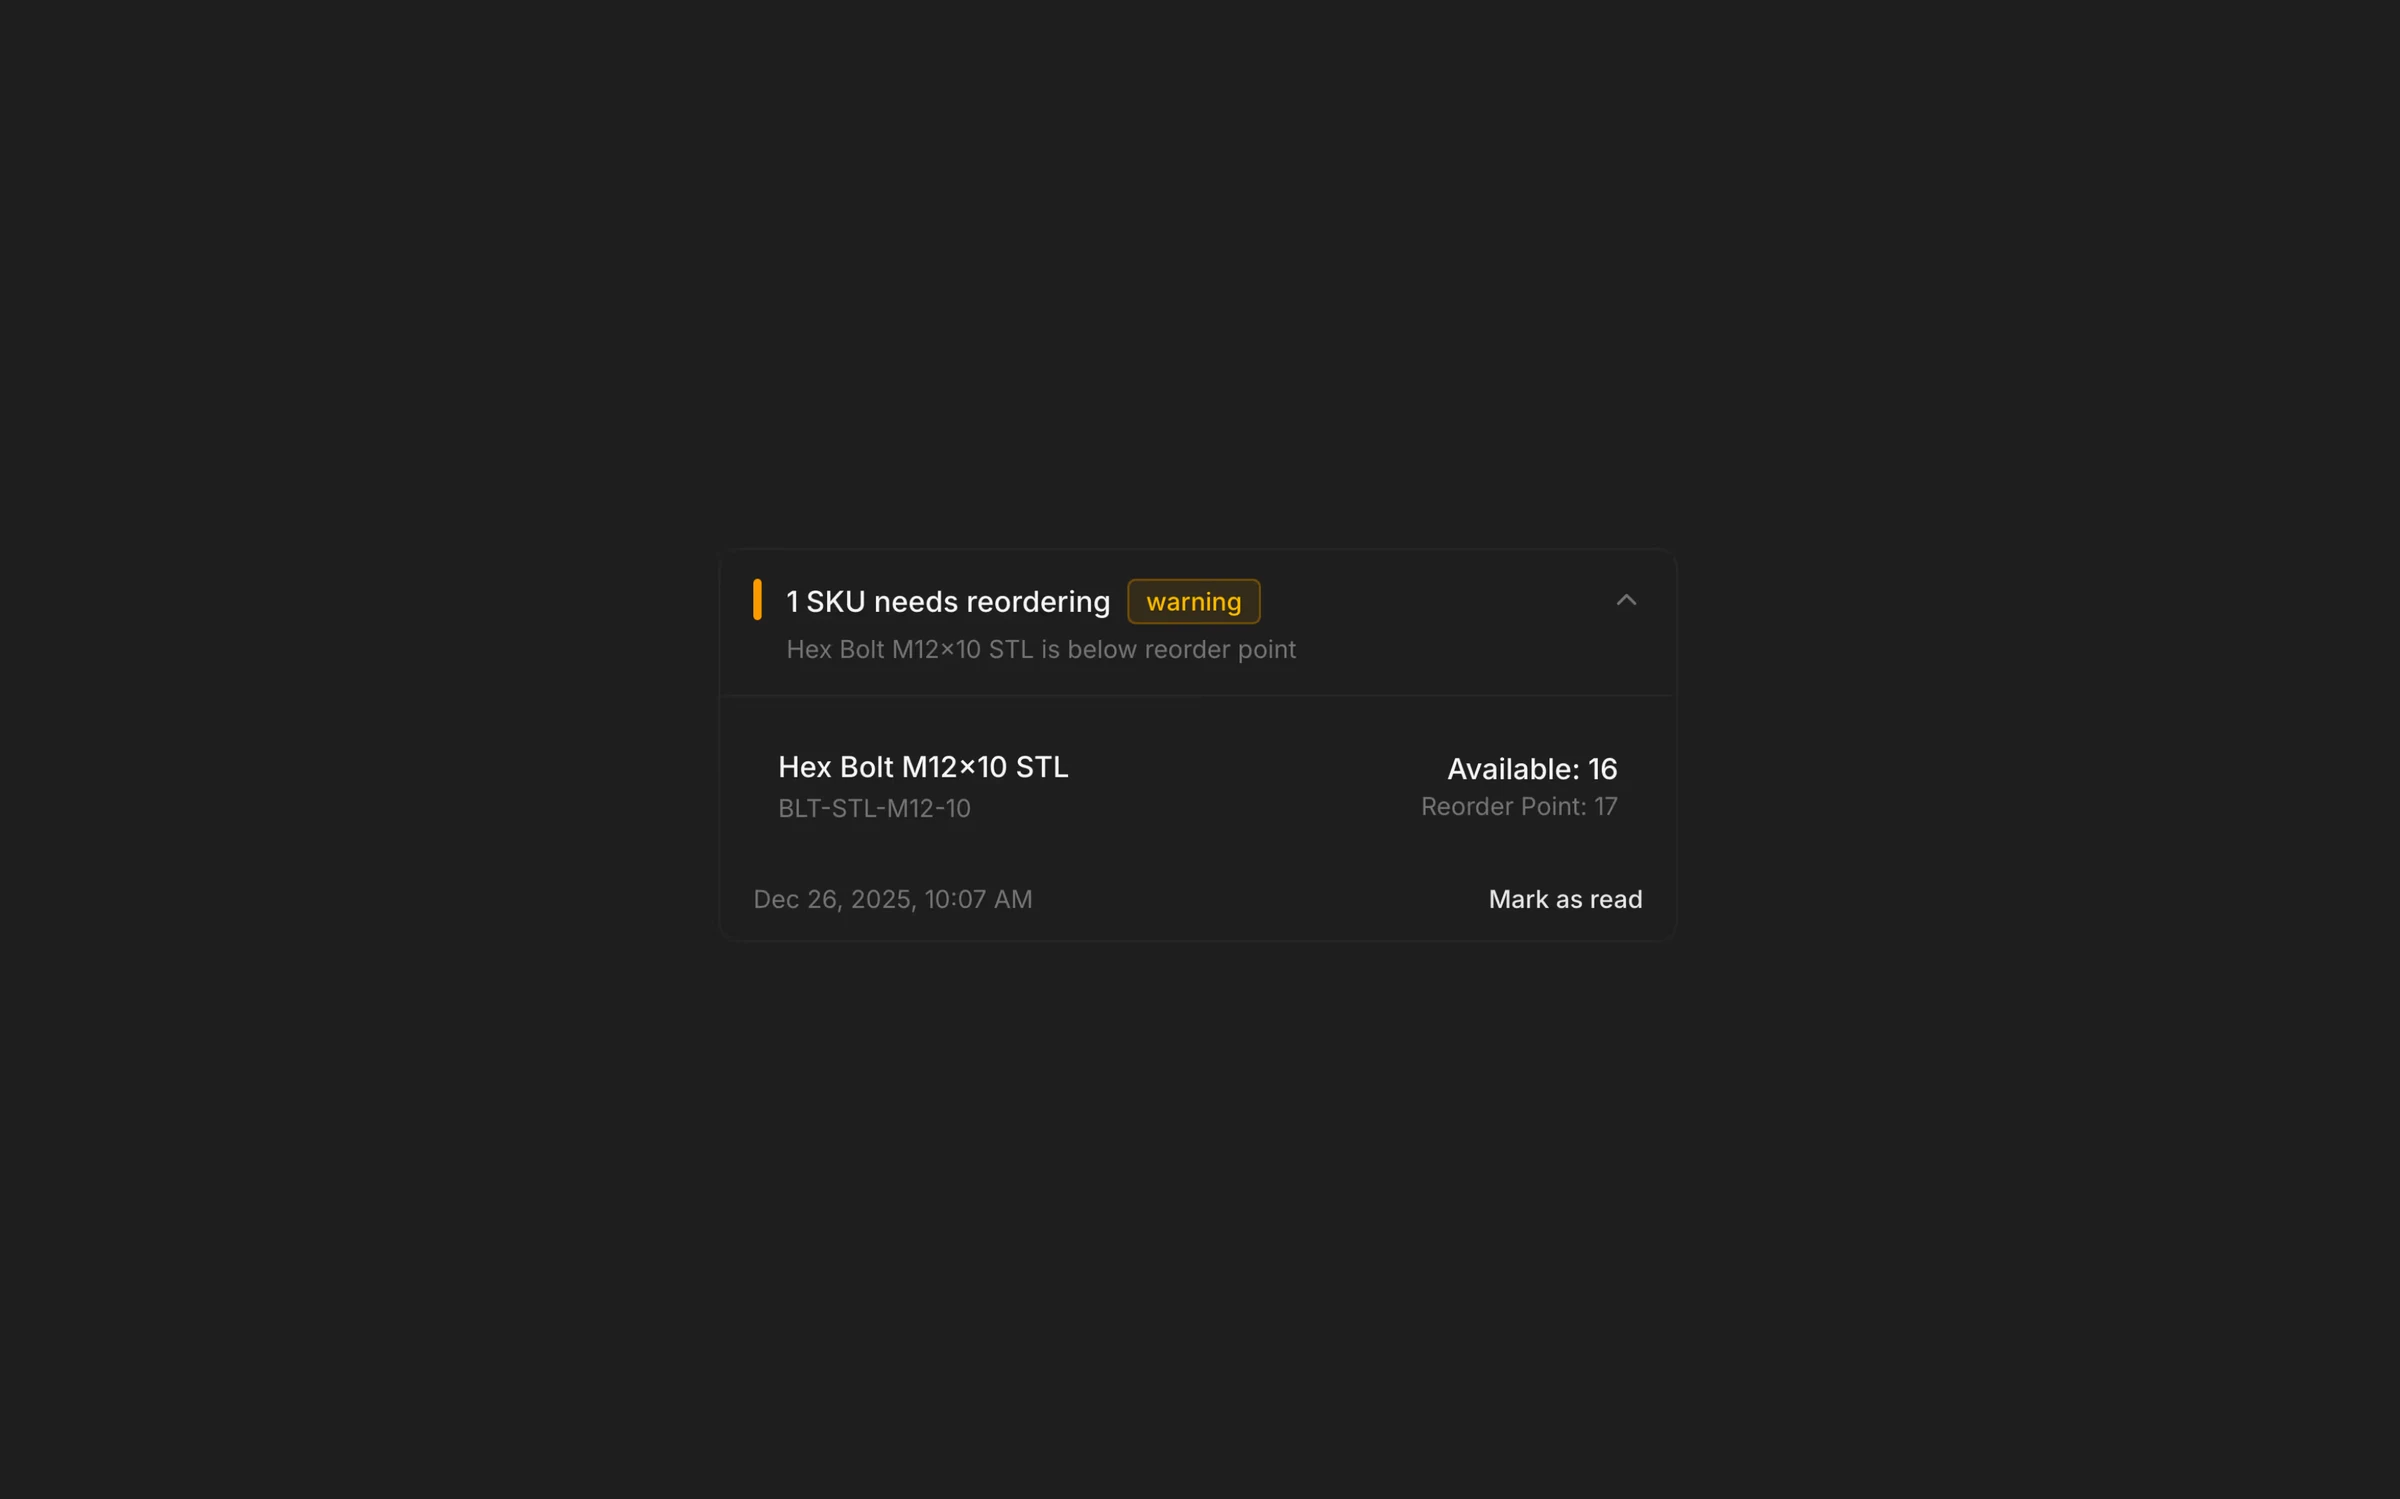
Alerts are only useful if they are trusted. We’ve shipped the first version of our Intelligent Alerting Engine, designed to solve the "alert fatigue" common in traditional inventory systems. Instead of flooding you with noise, Nooryx aggregates and prioritizes information so you can focus on what actually requires action.
The system is built on Severity Logic that clearly distinguishes between urgency levels: Low Stock (Warning) and Out of Stock (Critical). These states are driven by reorder point triggers that you can configure specifically per SKU.
We’ve introduced Unread Indicators, a real-time badge in the sidebar that serves as a subtle but persistent notification of urgent issues. The system aggregates alerts intelligently, grouping related notifications to prevent spam and ensure that when Nooryx notifies you, it’s a signal worth paying attention to.
You retain full control over the volume of notifications, with the ability to disable alerts globally or fine-tune the system by silencing specific SKUs."
Team Collaboration

We’ve built the Team Collaboration system and flow to make scaling your operations as frictionless as possible.
You can now expand your workspace simply by inputting a team member’s email address. There is no need for complex provisioning or manual account creation on your end; the system handles the logistics.
Once invited, the team member receives a secure invitation email. This triggers a dedicated onboarding flow that safely authenticates them and bridges them directly into your shared workspace. This ensures that everyone s operating within the same secure environment, looking at the exact same real-time inventory state from day one.
Financial Visibility
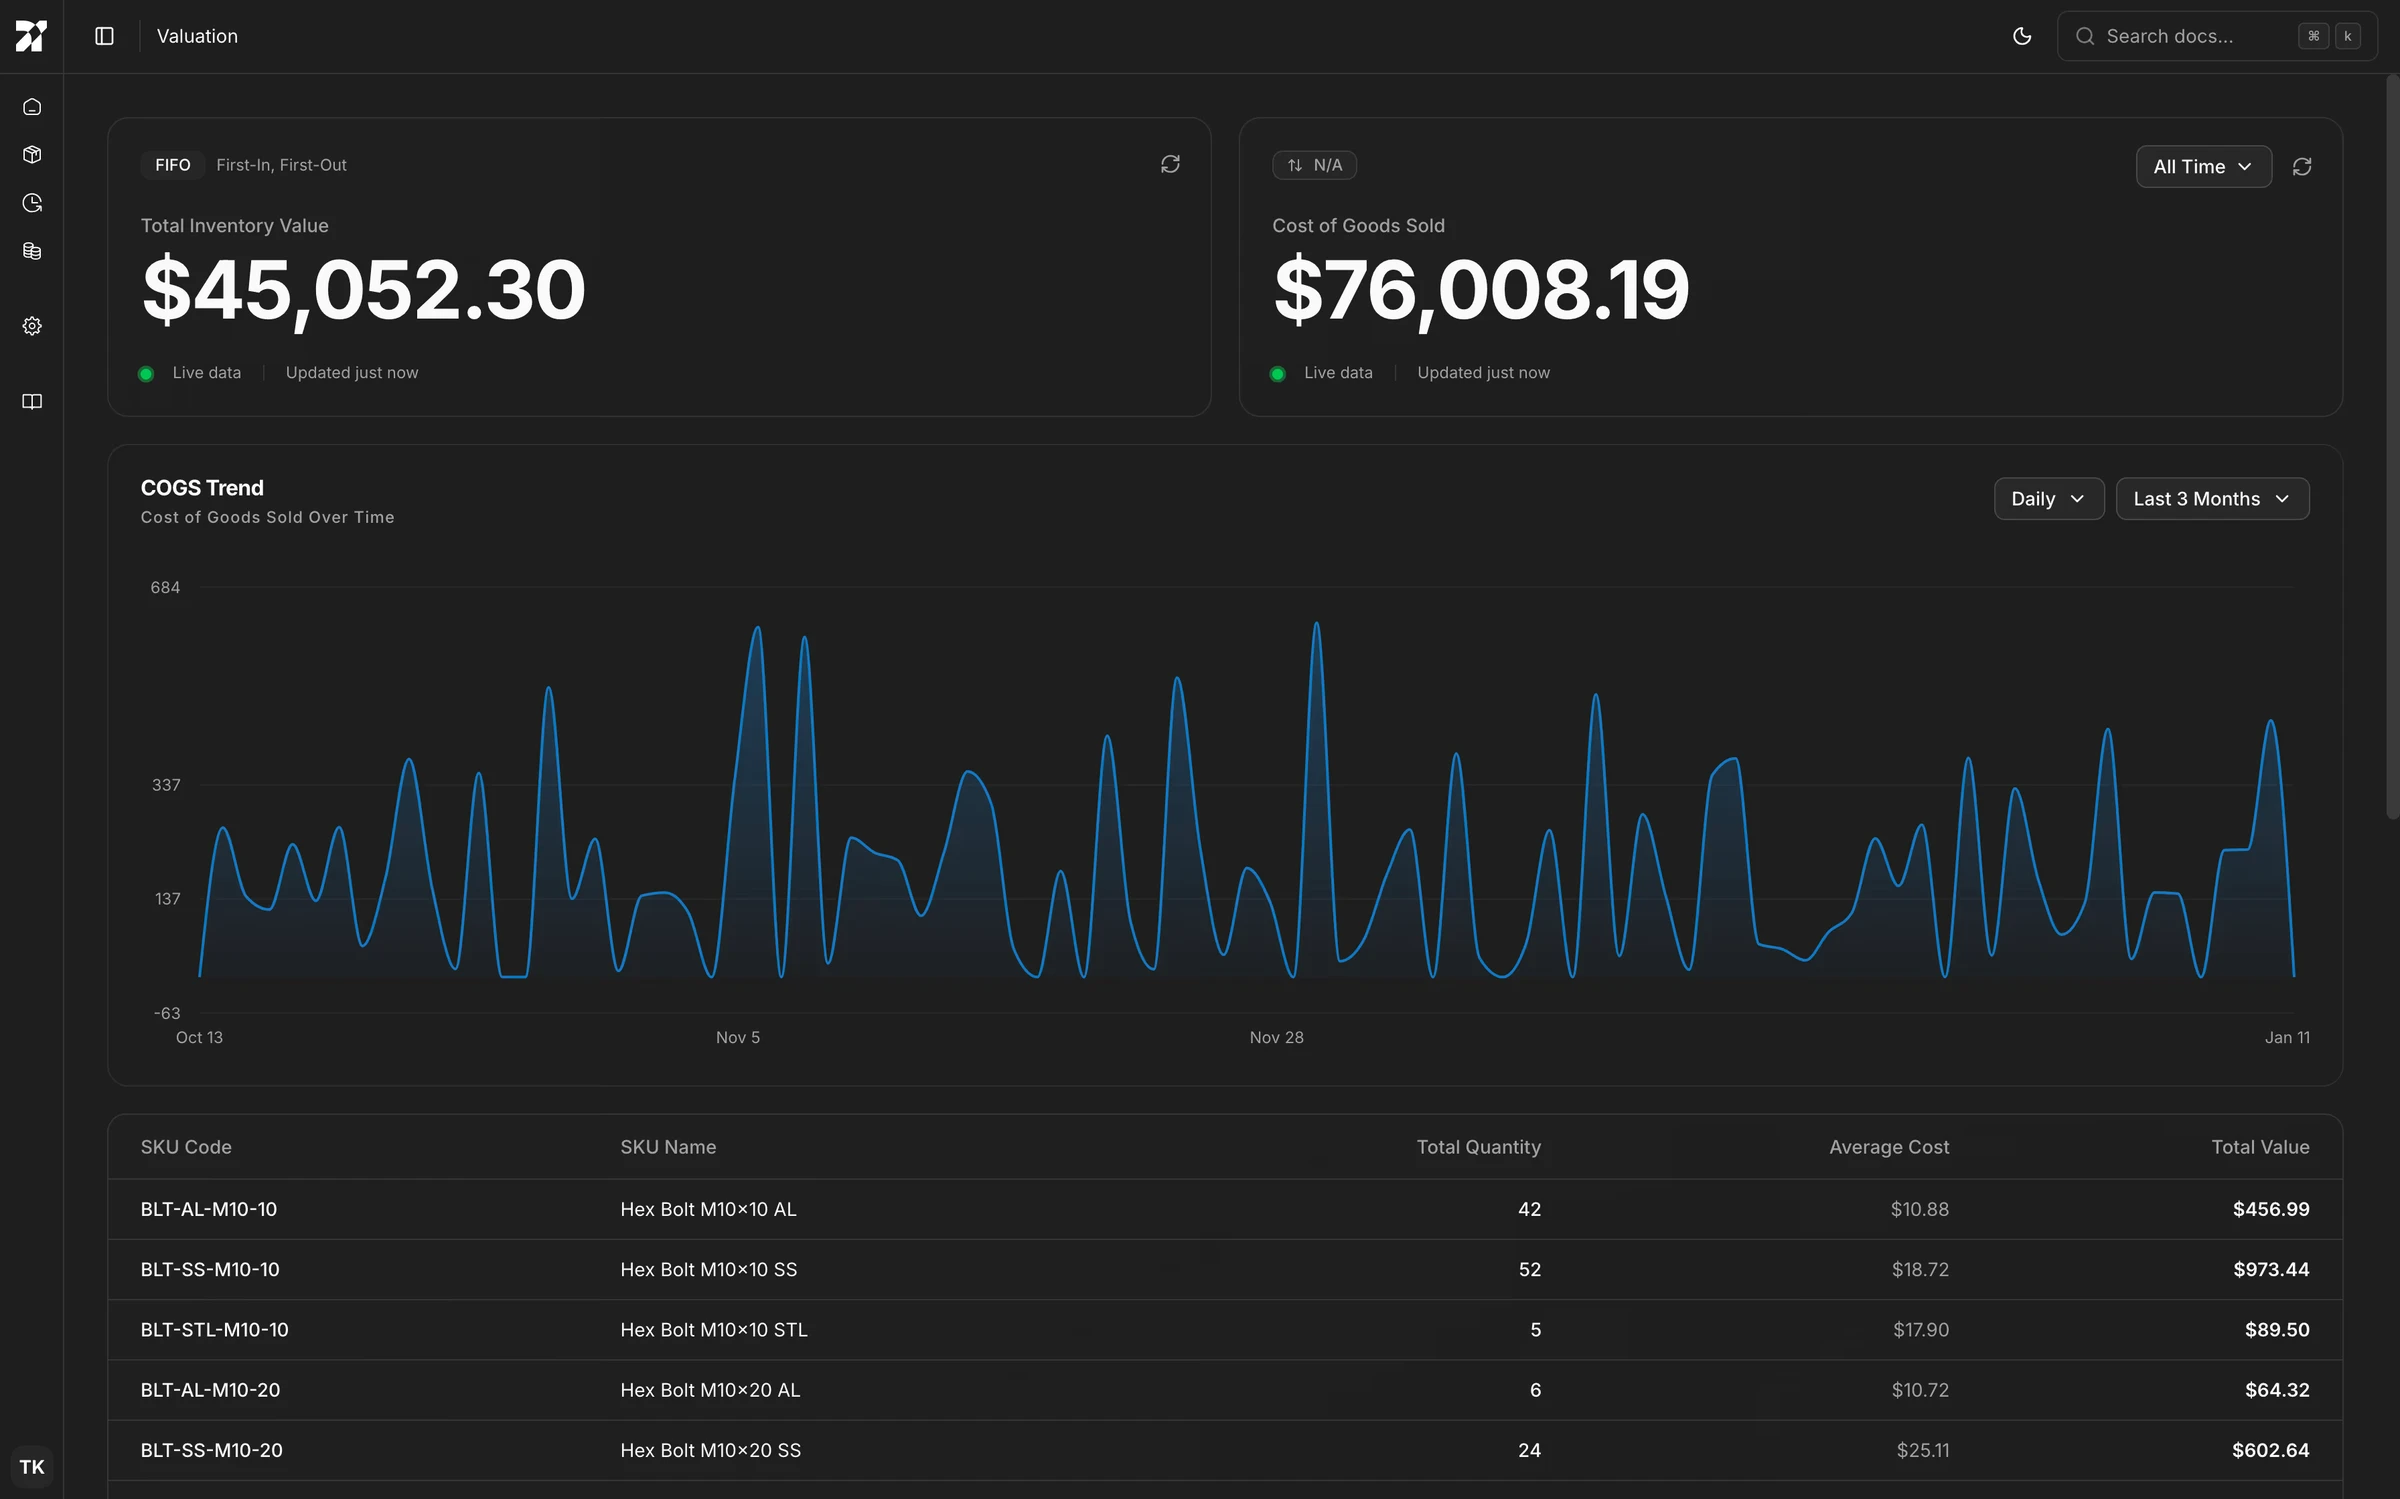
Inventory management is ultimately about capital efficiency. We’ve introduced the Valuation Interface to bridge the gap between operational logistics and financial reporting, giving you a real-time view of the capital tied up in your stock.
This interface transforms operational movements into financial metrics using your workspace’s configured valuation method (e.g., FIFO, LIFO, or Weighted Average).
- Real-Time Asset Value: The interface leads with your Total Inventory Value. This is a live calculation of all assets currently on hand, automatically reconciled against your operational ledger.
- Cost of Goods Sold (COGS): We track the cumulative cost of inventory leaving your warehouse. This allows you to monitor profitability and burn rate without waiting for end-of-month reconciliation.
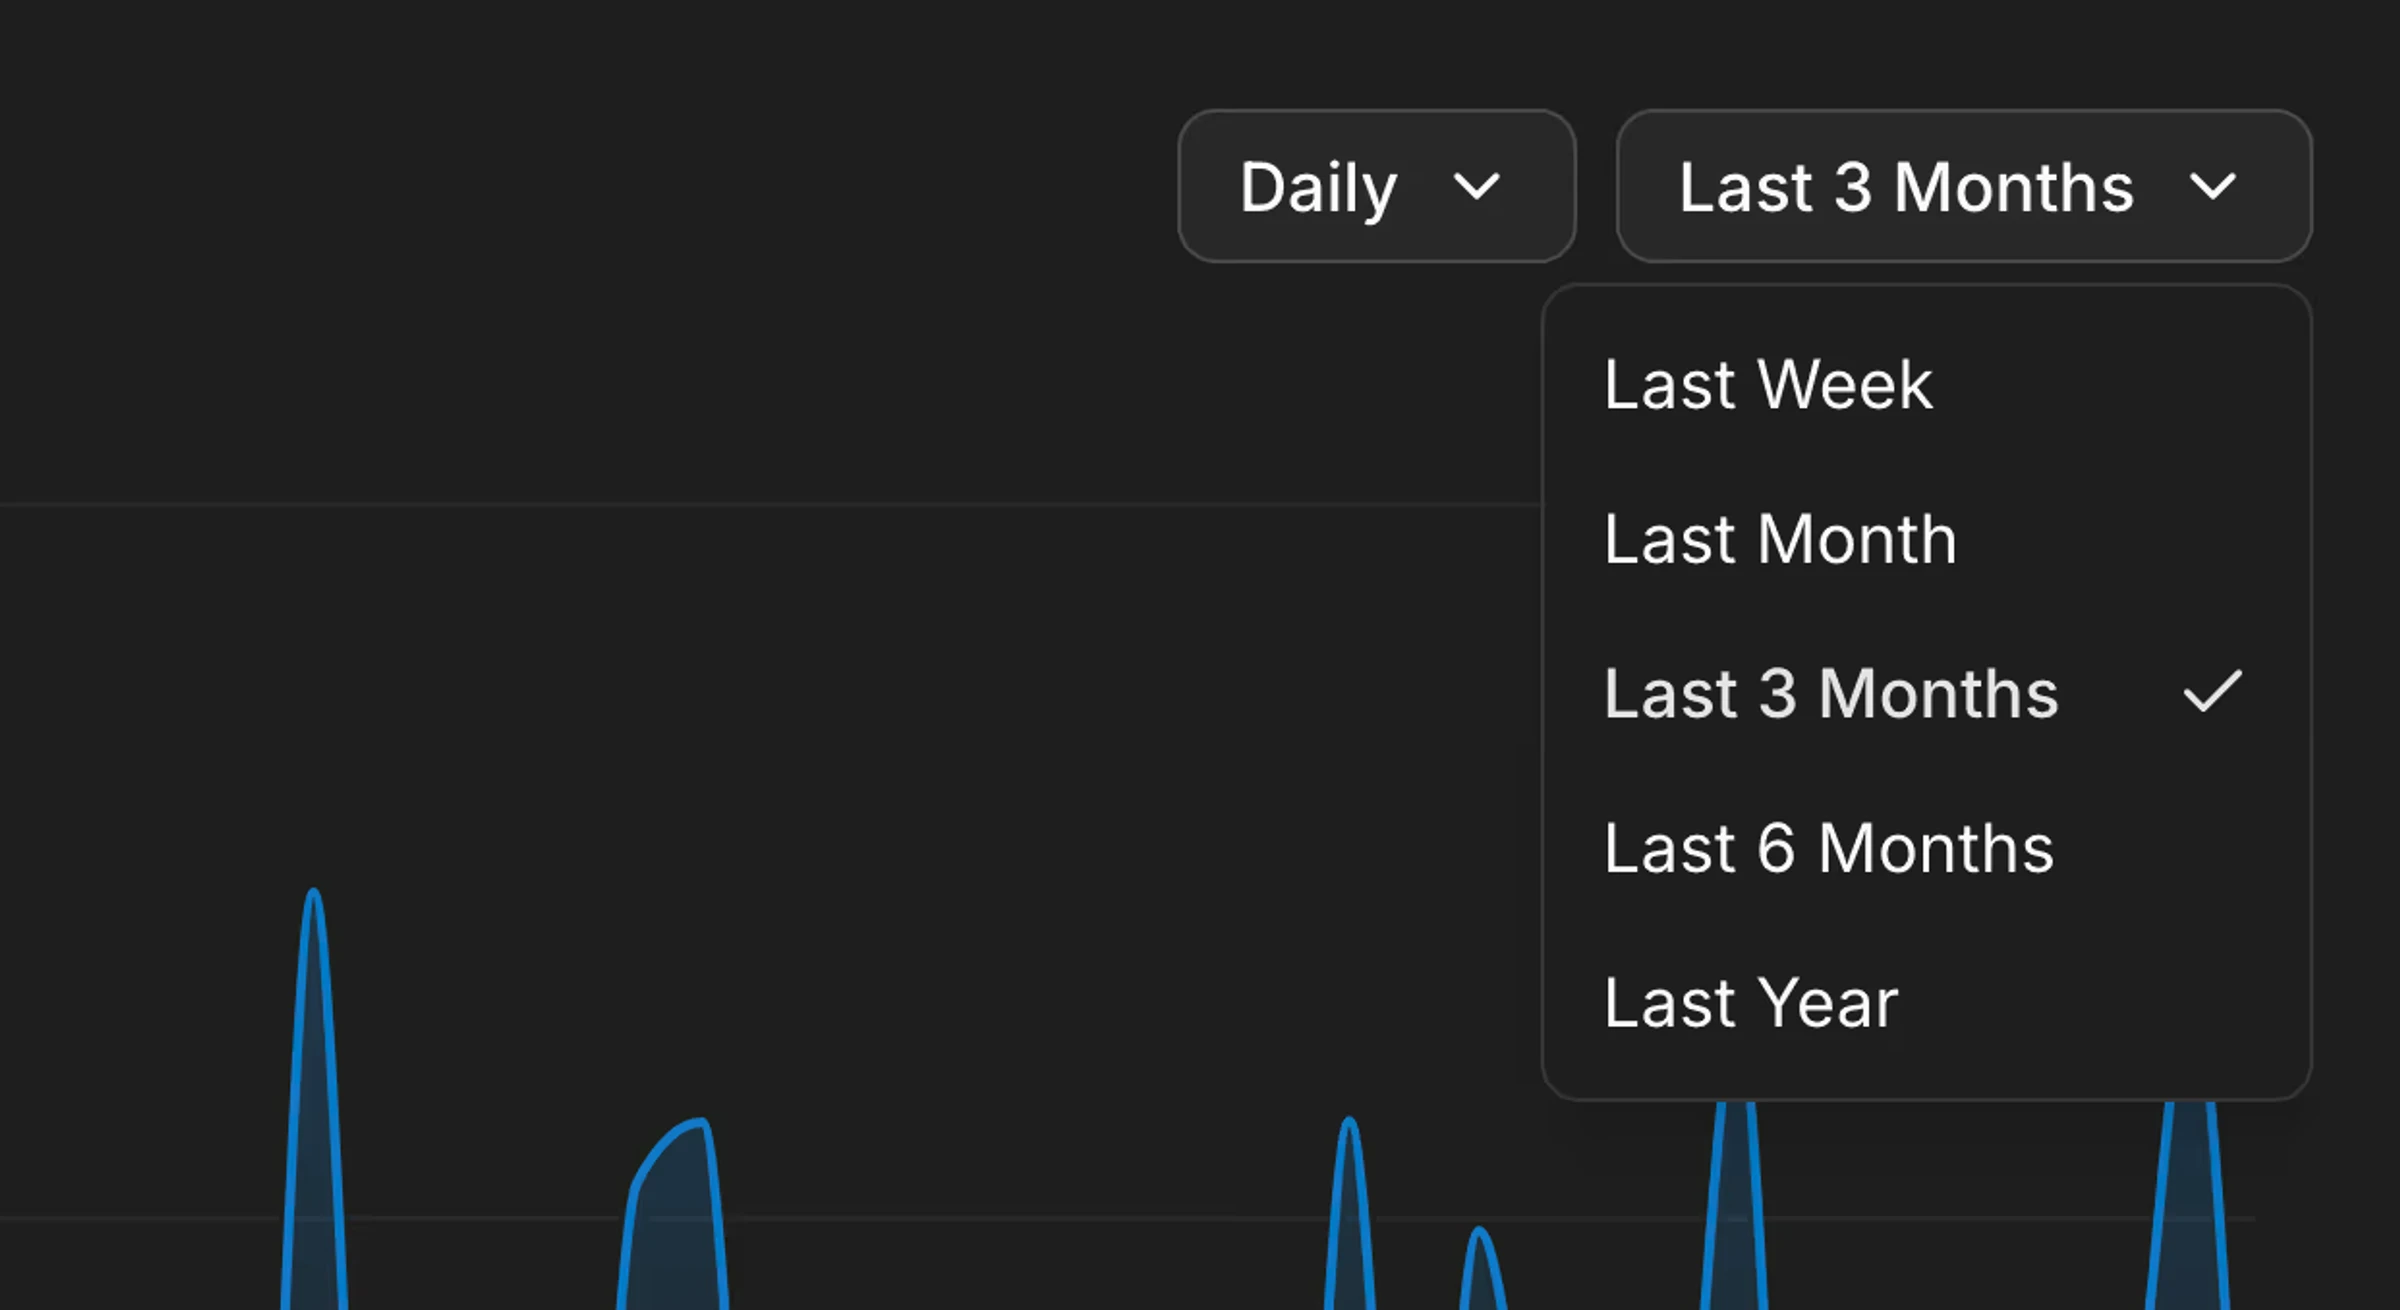
We’ve designed the data visualization to be flexible. The COGS Trend chart allows you to visualize financial velocity over time with granular precision. You can toggle specific time buckets (e.g., Daily views) and adjust the date range (e.g., Last 3 Months or All Time) to analyze seasonal spikes or specific operational periods.
For granular auditing, the detailed breakdown table lists every SKU with its Total Quantity, Average Cost, and Total Value. This helps you instantly identify which specific products are driving up holding costs.
SKU Detail Interface
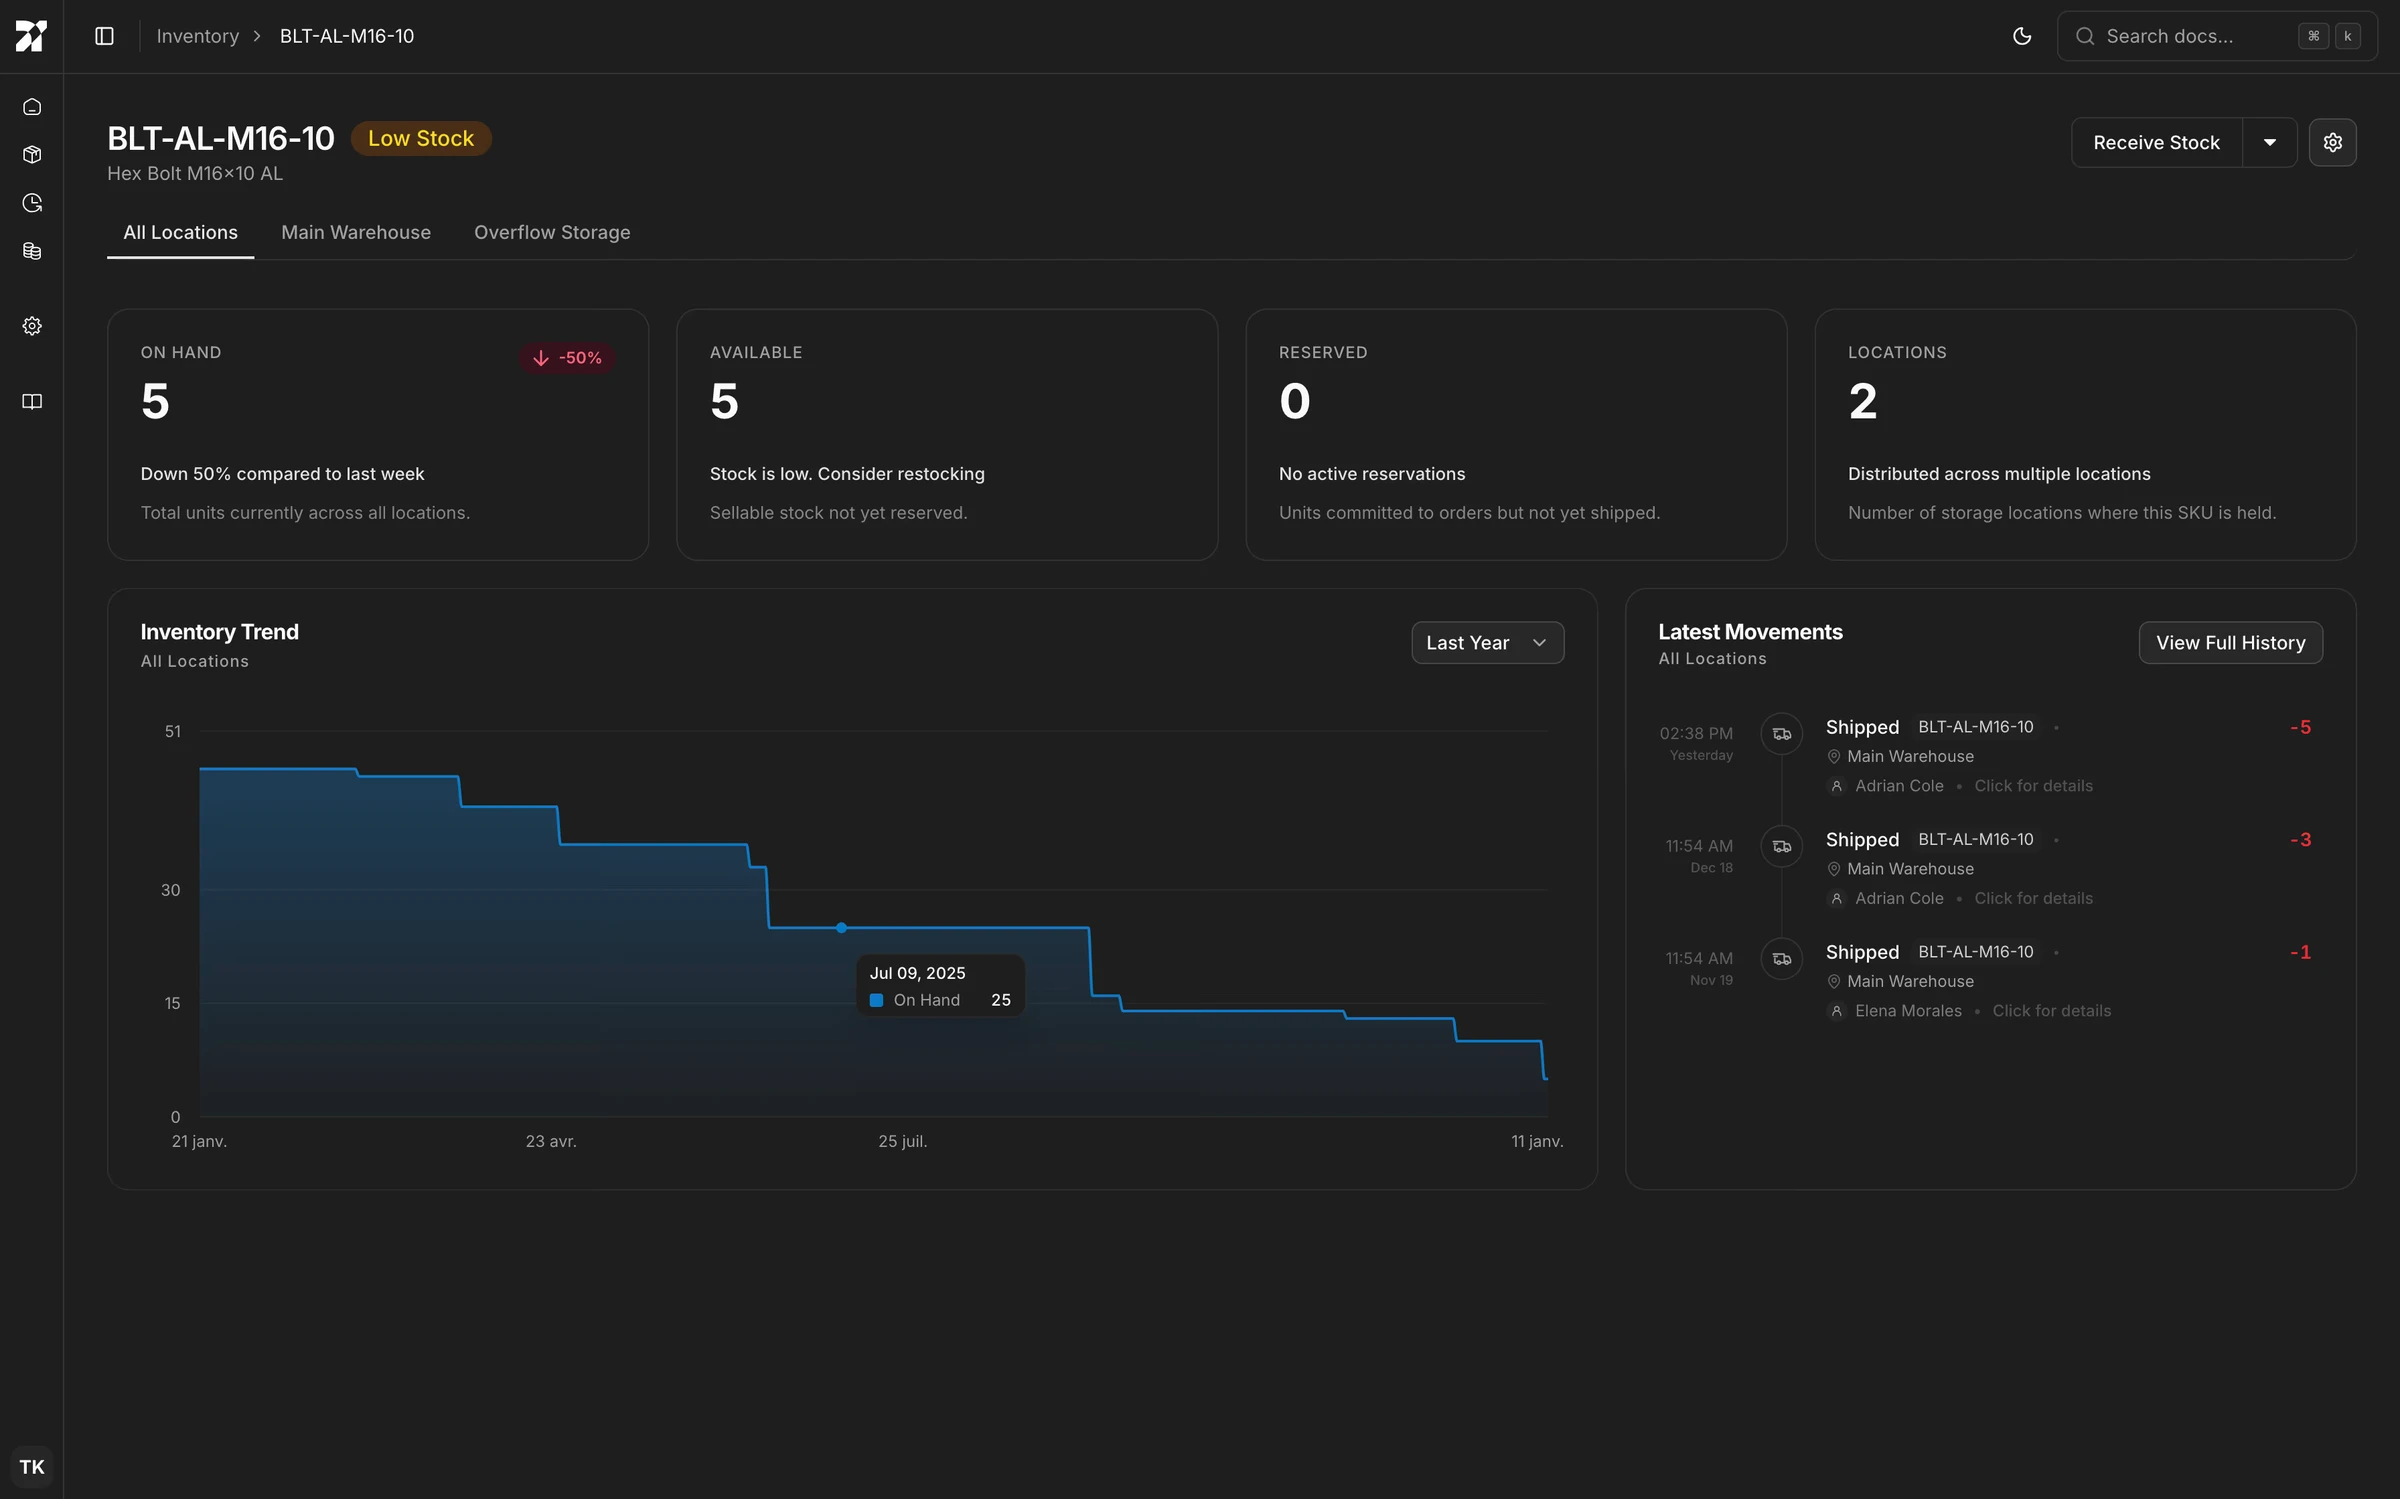
We’ve introduced the SKU Detail Interface to provide a granular, deep-dive view into the lifecycle of every individual item in your catalog. While the Dashboard offers a global overview, this interface is where specific product investigations and targeted operations take place.
This view centralizes the three most important aspects of single-item management:
- State: Clear separation between On Hand, Available, and Reserved stock, along with a count of Active Locations.
- History: A scoped Latest Movements feed that acts as a mini-audit trail for just this item, paired with an Inventory Trend graph to visualize burn rates and restocking cycles over time.
- Context: Location tabs allow you to instantly toggle between a global view of the SKU or a single, specific location.
We designed this page for high-velocity operations. Actions taken here are context-aware: clicking "Receive Stock" or "Ship Stock" opens the form pre-filled with the current SKU, removing redundant data entry and reducing the risk of selecting the wrong product.
Furthermore, we’ve overhauled the input experience across the platform. All SKU and Location selectors now feature instant search, allowing you to locate specific items or warehouses immediately, without scrolling through thousands of records or needing to type exact matches.
The Dashboard
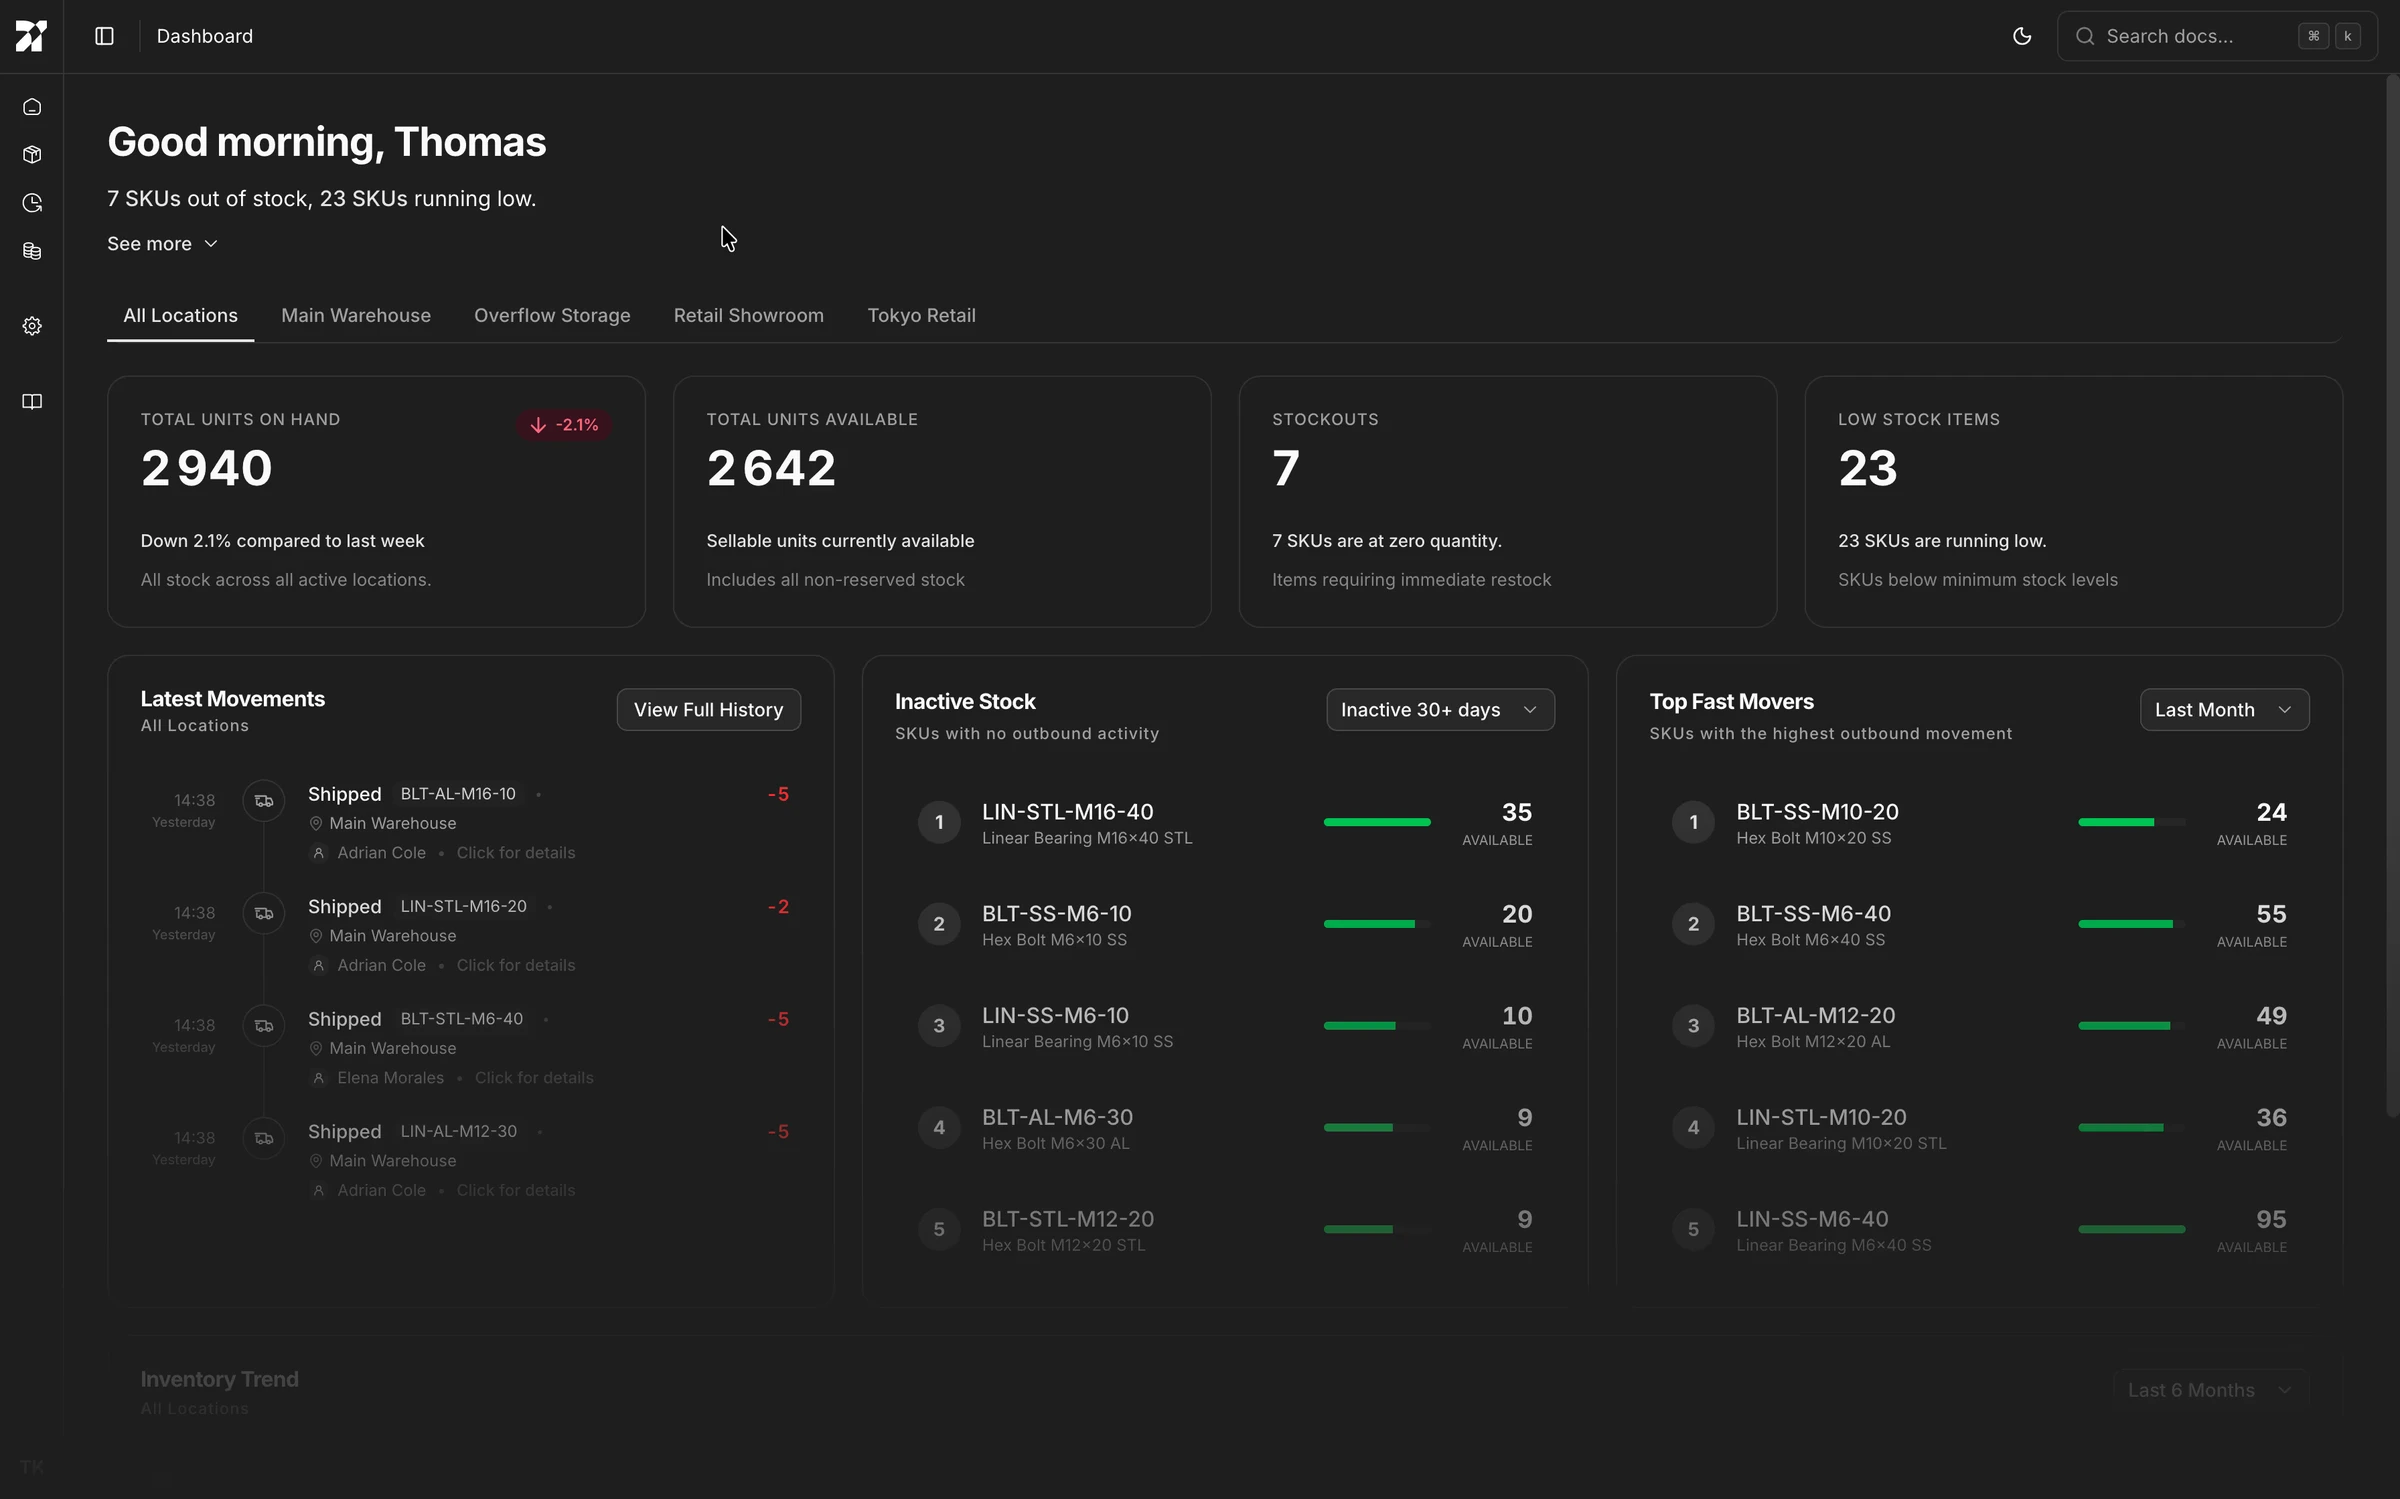
We’ve introduced the Dashboard to serve as the central command center for your operations. Instead of burying data in reports, the Dashboard synthesizes the real-time state of your inventory into a single, actionable view immediately upon login. It answers the most critical question operators have at the start of the day: "What needs my attention right now?"
The view is anchored by high-level metrics that distinguish between physical and sellable inventory. We display Total Units on Hand alongside Total Units Available. To help you react quickly to supply chain risks, dedicated indicators highlight Stockouts and Low Stock Items.
Beyond static numbers, the Dashboard provides insight into inventory velocity and activity:
- Latest Movements: A real-time feed of the most recent shipping, receiving, and adjustment events. This offers a pulse check on warehouse activity without needing to dive into the full audit trail.
- Inventory Velocity: We identify your Top Fast Movers to ensure you keep high-demand items in stock, while simultaneously flagging Inactive Stock so you can identify capital tied up in dormant inventory.
- Inventory Trend: A visual trajectory of your stock levels over time, helping you spot burn rates and seasonality patterns at a glance.
The entire Dashboard is context-aware. You can view aggregated data across All Locations for a global picture, or filter down to specific warehouses or retail showrooms to isolate local inventory health.
Customize your experience
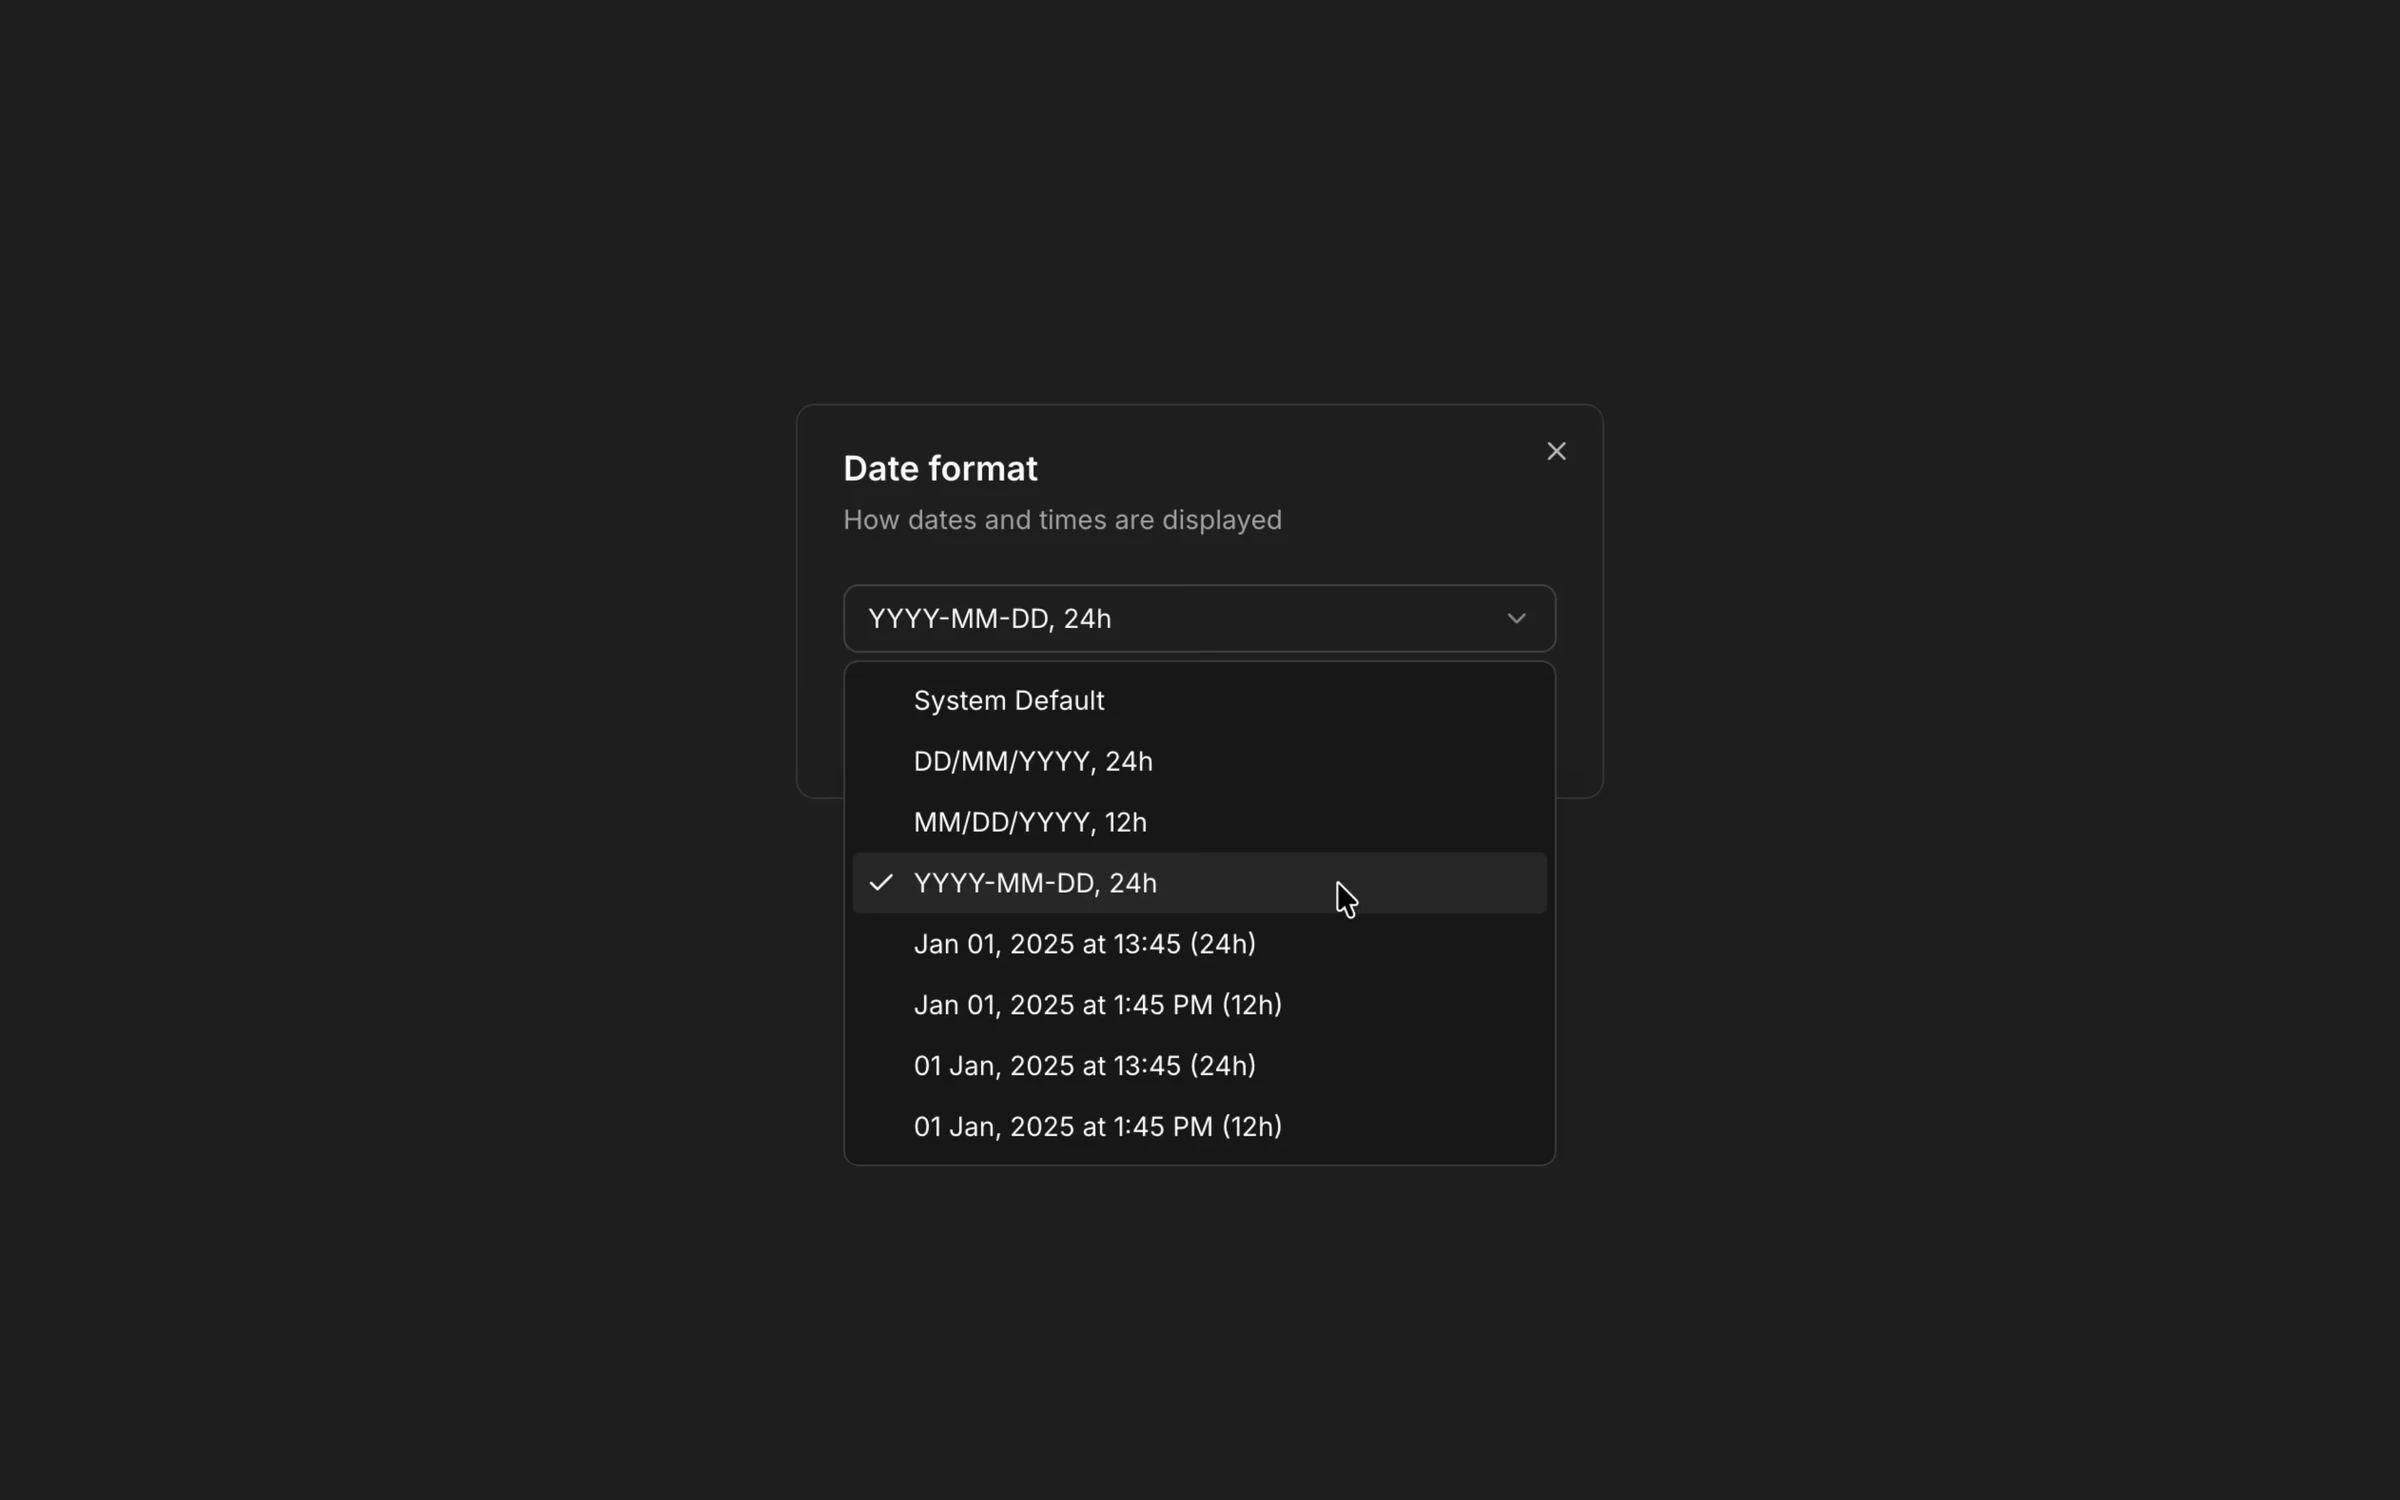
You can adjust Nooryx to better match how you work and what you’re used to. In the settings, choose your preferred theme, date format, and locale, so the interface feels natural day to day.
For inventory setup, you can define default low-stock thresholds and default reorder point that apply automatically when creating new SKUs. The settings area also gives you access to subscription and billing information, so you can review your plan and invoices in one place.
Finally, you can see all active sessions and connected devices associated with your account. From there, you can review recent activity and end sessions you no longer recognize or need.
Find inventory instantly
We’ve improved how you explore and manage your inventory. You can now find any SKU instantly using real-time search across your entire catalog. The inventory view lets you filter products by stock status (whether they’re in stock, running low, or fully out of stock) and sort results by any column to surface exactly what matters to you. We’ve also added more control over pagination, so you can choose how many items are displayed per page and scan large inventories more comfortably.
The Audit Trail Interface
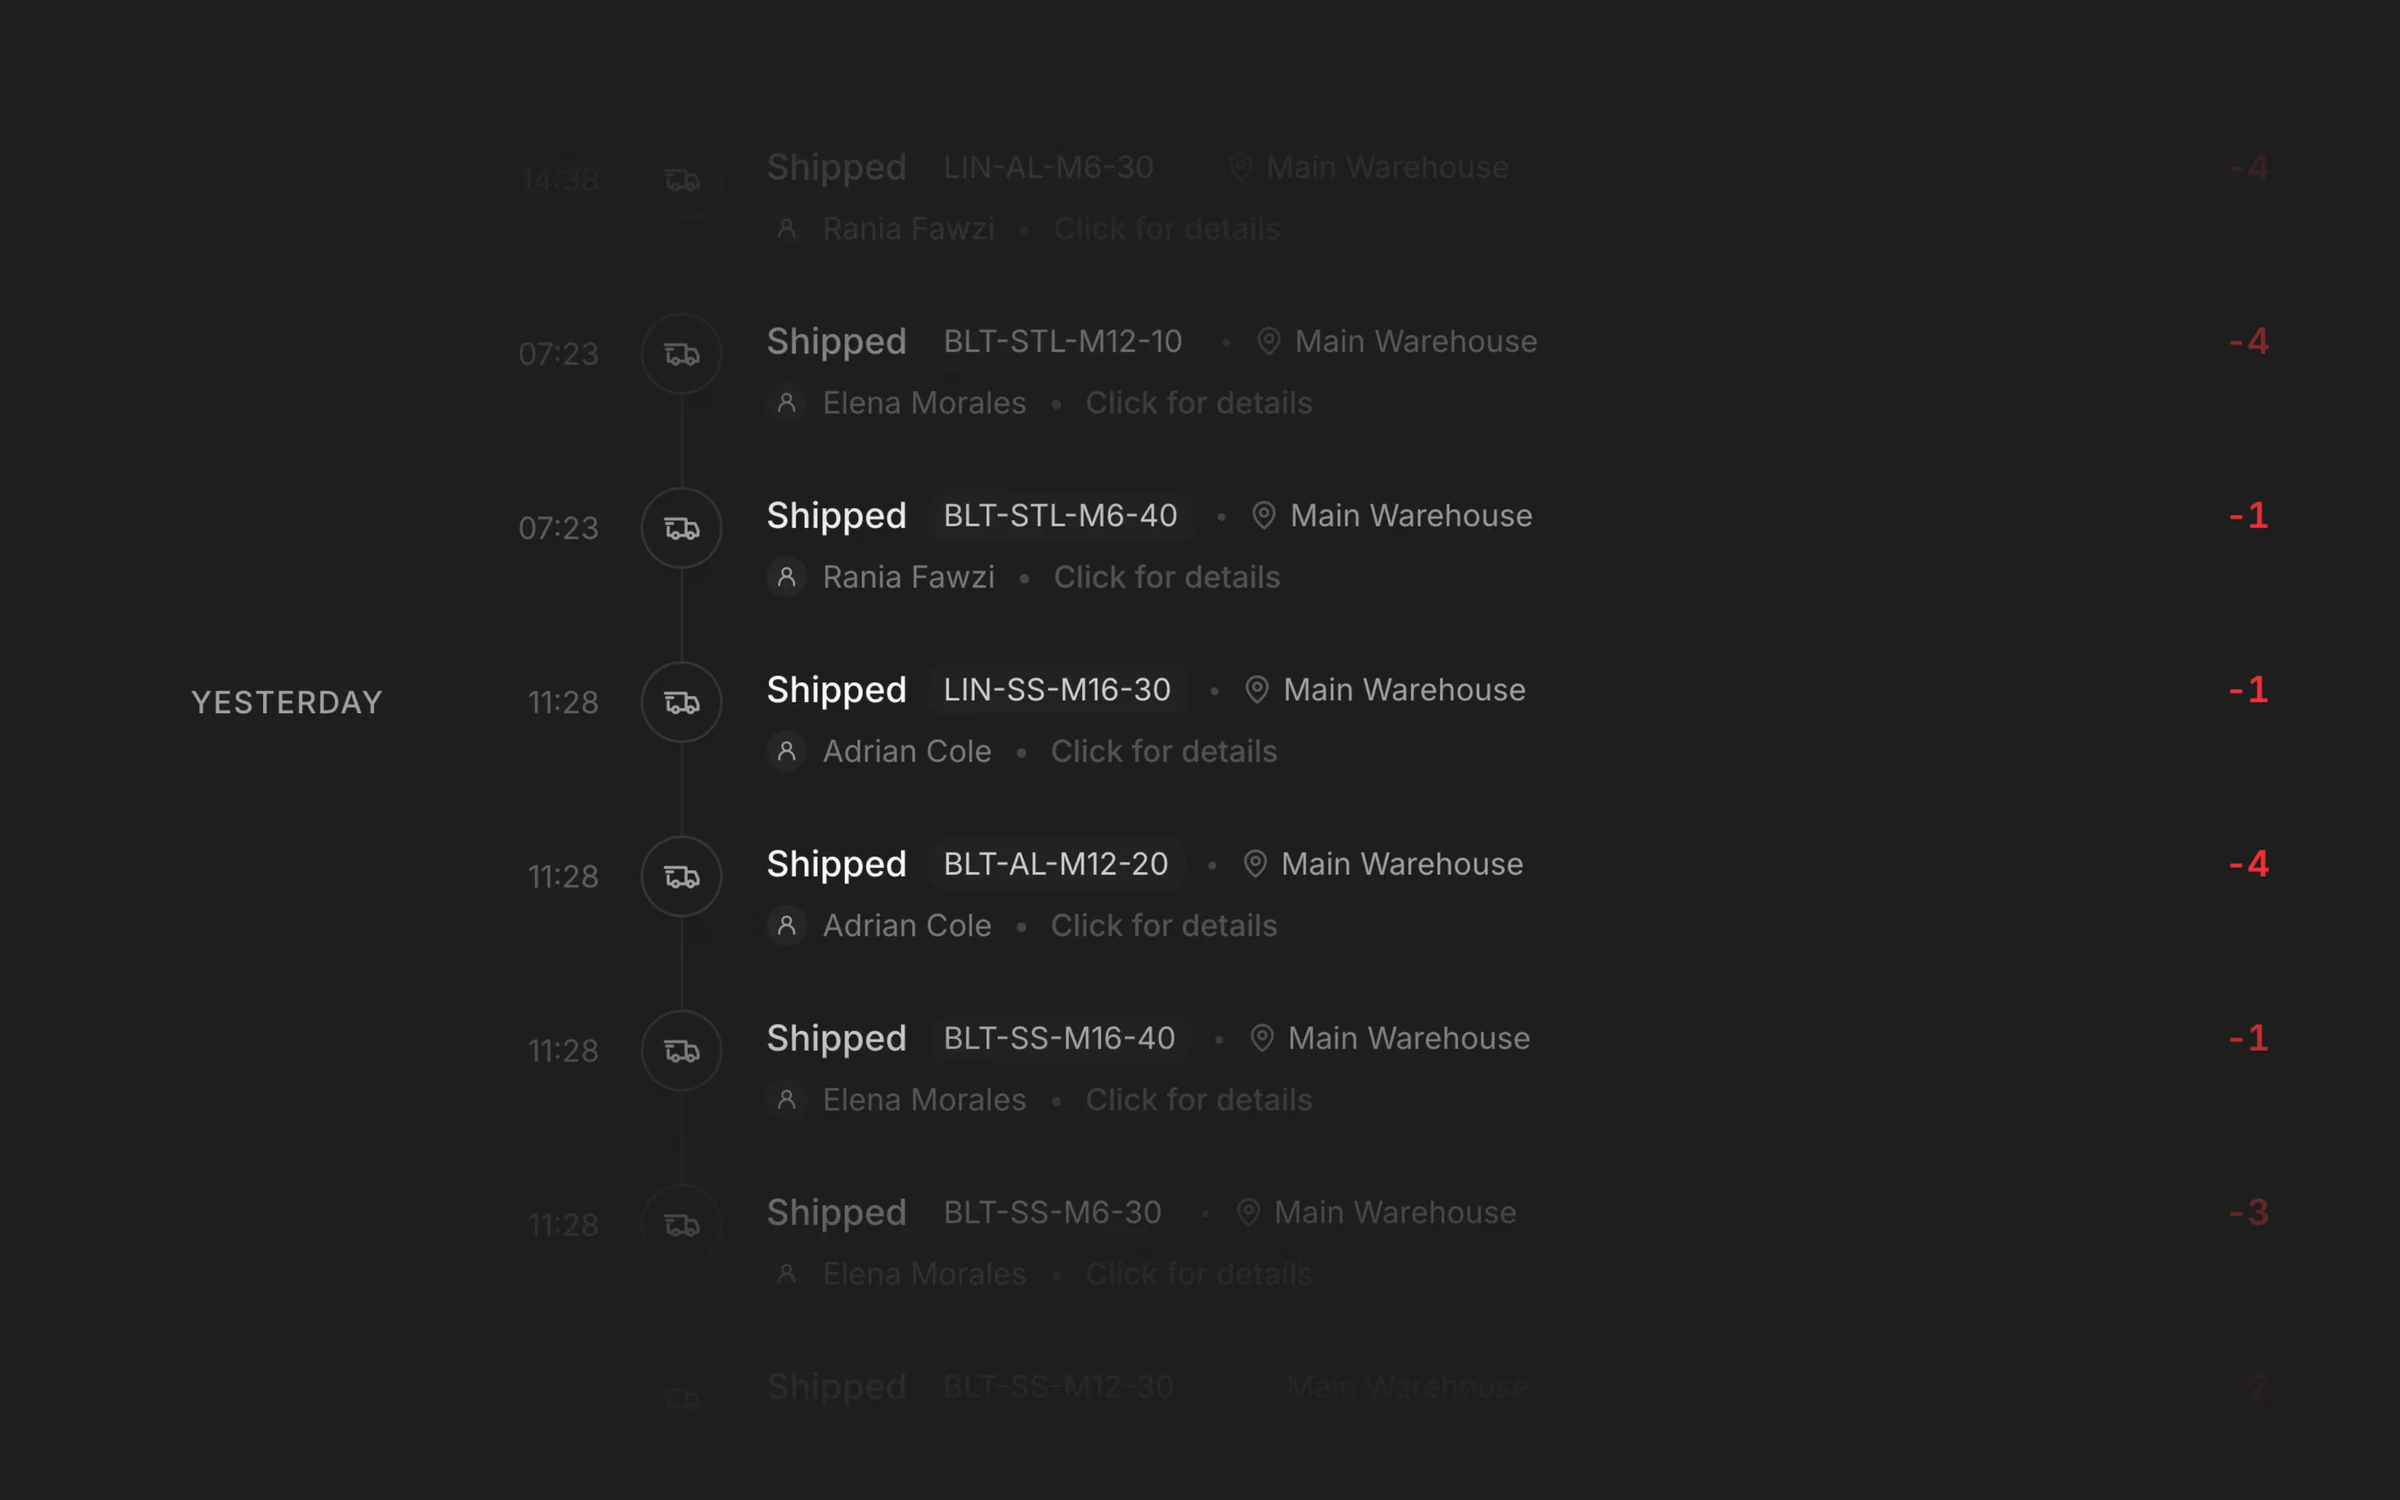
We’ve introduced a dedicated Audit Trail interface to give you full visibility into every change that happens to your inventory. Instead of piecing things together from scattered logs, you can now follow a clear, chronological timeline of all inventory events, from the most recent updates to the earliest movements.
Each entry shows exactly what changed, when it happened, and who performed the action, making it easy to understand the story behind your stock levels. Whether you’re investigating a discrepancy, reviewing team activity, or preparing for an internal audit, the full context is always available.
To help you find what matters quickly, the audit trail supports search and filtering across all transactions. Narrow down results by product, action type, location, or actor and focus only on the events relevant to your investigation.
Finally, the interface gives you control over how much information you see at once. You can adjust the number of entries displayed per page.
The Foundation

We’ve built the core inventory operations that everything else in Nooryx relies on. These are the everyday actions teams use to manage stock, implemented with an emphasis on correctness, consistency, and clear behavior.
Inventory is managed through dedicated flows for the main operations:
- receiving stock into a location
- shipping stock out
- adjusting quantities when corrections are needed
- reserving stock for future use or orders
- transferring stock between locations
Each operation uses a structured form that reflects how the action works in practice. Quantities, products, and locations are validated in real time so common issues (like invalid values, missing context, or impossible states) are caught before the operation is recorded.
All inventory changes are recorded as events in an internal ledger. Instead of directly overwriting stock levels, each operation produces a permanent record of what happened. Current inventory levels are derived from this history, which makes stock states easier to reason about and inspect over time.
Operations are always tied to a specific location. Stock is tracked per location by default, and transfers are handled as explicit movements rather than hidden adjustments. This keeps inventory consistent when working across multiple warehouses, stores, or internal areas.
Each inventory event is also evaluated using the workspace’s selected stock valuation method (FIFO, LIFO, or weighted average). This ensures quantities and value stay aligned as inventory moves, without requiring manual reconciliation later.
All of this lives within a workspace-based setup. Each company’s data is isolated, while team members work inside a shared environment with the same real-time inventory view. Actions, history, and calculations are scoped to the workspace, making collaboration predictable as teams grow.
This work establishes the baseline for Nooryx: inventory operations that behave consistently, record changes explicitly, and support accurate stock tracking over time.